
Volume 10, Issue 3 (10-2022)
Jorjani Biomed J 2022, 10(3): 43-50 |
Back to browse issues page

Download citation:
BibTeX | RIS | EndNote | Medlars | ProCite | Reference Manager | RefWorks
Send citation to:


BibTeX | RIS | EndNote | Medlars | ProCite | Reference Manager | RefWorks
Send citation to:
Ramedani A, Simchi A, Sabzevari O. Fluorescent Contrast agent Based on Graphene Quantum Dots Decorated Mesoporous Silica Nanoparticles for Detecting and Sorting Cancer Cells. Jorjani Biomed J 2022; 10 (3) :43-50
URL: http://goums.ac.ir/jorjanijournal/article-1-921-en.html
URL: http://goums.ac.ir/jorjanijournal/article-1-921-en.html


1- Institute for Nanoscience and Nanotechnology, Sharif University of Technology, Tehran, Iran
2- Institute for Nanoscience and Nanotechnology, Sharif University of Technology, Tehran, Iran/ Department of Materials Science and Engineering, Sharif University of Technology, Tehran, Iran ,simchi@sharif.edu
3- Toxicology and Poisoning Research Centre, Tehran University of Medical Sciences, Tehran, Iran/ Department of Toxicology & Pharmacology, Faculty of Pharmacy, Tehran University of Medical Sciences, Tehran, Iran
2- Institute for Nanoscience and Nanotechnology, Sharif University of Technology, Tehran, Iran/ Department of Materials Science and Engineering, Sharif University of Technology, Tehran, Iran ,
3- Toxicology and Poisoning Research Centre, Tehran University of Medical Sciences, Tehran, Iran/ Department of Toxicology & Pharmacology, Faculty of Pharmacy, Tehran University of Medical Sciences, Tehran, Iran
Full-Text [PDF 808 kb]
(1404 Downloads)
| Abstract (HTML) (4273 Views)
Nanoparticles were absorbed to the surface of cancer cells through folic acid. When a large number of these nanoparticles accumulate in the cancer cell, they cause a detectable fluorescence signal that enables sorting of the droplets at about 200 Hz. The described microfluidic system is easily adapted for cancer cell screening. The microfluidic procedure takes 4 hours to screen 1 million cells.
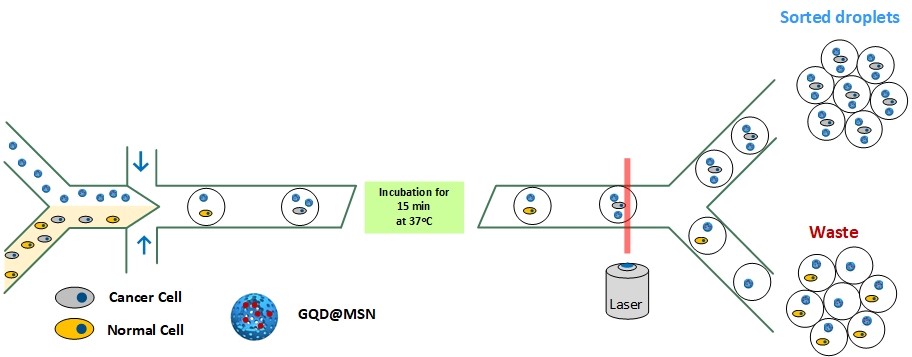
Figure 1. Principle of cancer cell sorting
.jpg)
The FESEM image of the prepared GQDs@MSN is illustrated in Figure 3. As seen in Figure 3, GQDs@MSN are nanoparticles with a uniform spherical shape and an average particle size of 250 nm. In addition, DLS data indicate that the size of these nanoparticles is slightly larger than this amount, which explains this variation in hydrodynamic nanoparticle diameter.
.jpg)
.jpg)
Figure 4. (a) Design of microfluidic devices. (b) Bright-field image of droplet MCF-7 cells after microfluidic sorting (c) Red fluorescenc single MCF-7 cells
Full-Text: (1508 Views)
Introduction
A substantial amount of progress has been achieved over the past several years in our knowledge of cancer, leading to improved methods for detecting and treating cancer. Microfluidic devices can greatly enhance high-throughput cell-based assays. High-throughput single-cell assays are described in this procedure using droplet microfluidics systems (1, 2). Microfluidic systems based on droplet microfluidics are simple: droplets of water flow in an inert carrier oil via microfluidic channels on a chip, where each droplet acts as a microreactor. As a result, each droplet serves as a microtiter plate well. Because the droplet volume is often in the picoliters to nanoliters range, the reaction volume is thousands to millions of times less than in a microtiter plate well (3). Droplet analysis is usually done using fluorescence techniques, and for this purpose, the droplets can be incubated in on-chip or off-chip reservoirs. Droplet classification is usually done using systems based on dielectrophoresis or sound waves. Then the drops are broken for specific purposes, and the contents inside the drops are checked. Nowadays, droplet-based microfluidic systems are being developed for various applications such as DNA sequencing, single-cell analysis, diagnostics, drug screening, and complex multi-step biological and chemical assays. Encapsulated cells can be kept alive longer due to the use of fluorinated carrier oils that can dissolve oxygen 20 times more than water. In addition to being very weak solutions, these oils are suitable for cell-based and biochemical assays. Cells enclosed in droplets can be analyzed separately. This feature enables biochemical and genetic analyses of cells. It can amplify the released DNA or RNA and is not limited to the detection of cell surface grafts, which is usually the :case when: using methods such as FACS. Although the throughput of microfluidic sorting systems (≤2 kHz) is slower than FACS, the increased flexibility offered by droplet-based microfluidic systems offers many advantages. One of the main components of the microfluidic systems mentioned above to isolate and label cancer cells are fluorescent materials, the development of which significantly helps to increase the efficiency of this system. Many fluorescent materials have been developed so far for cellular techniques; here, we present one of the fluorescent materials based on quantum dots.
The unique properties of Mesoporous Silica Nanoparticles (MSN), such as physical and chemical stability, high specific surface area, porosity, and high biocompatibility, make them an ideal carrier for biological applications (4–7). Despite these advantages, MSN cannot emit observable optical signals to enable rapid detection. One solution to this limitation is decorating MSNs with fluorescent materials (8–11). Toxicology and chemical instability could restrict the utility of these compounds. For instance, Organic fluorescent dyes and Quantum Dots (QDs) could easily accumulate in the body's vital organs, thus reducing their combination's efficiency with MSN (12, 13). QDs are restricted in usage because of the severe toxicity, which includes heavy metals. But there has been a lot of interest in Graphene Quantum Dots (GQDs) due to their great biocompatibility and intense fluorescence (14, 15). Nitrogen-doped GQDs can provide an imaging depth of 1800 μm, far beyond two-photon imaging. Using these nanoparticles for cell imaging is not a new issue, but using them in microfluidic devices to isolate single cancer cells is a new issue (16). In this study, we report the development of a nanoparticle-enhanced biosensor by integrating both the nanoparticles and immunoassay sensing technologies (Figure 1). Herein, we obtained favorable luminescence properties for the isolation of cancer cells by using MSN nanoparticles decorated with fluorescent GQDs. The specific surface area and pore volume of these nanoparticles compared to pure MSN were 600 m²/g and 0.70 cm³/g. It was obtained, which leads to an increase of 50% and 40%, respectively. Most importantly, the aspirin loading capacity of GQDs-MSN can reach 30%, which is two times higher than that of pure MSN (18%). Furthermore, to target these nanoparticles, their surface was modified by folic acid.
Nanoparticles were absorbed to the surface of cancer cells through folic acid. When a large number of these nanoparticles accumulate in the cancer cell, they cause a detectable fluorescence signal that enables sorting of the droplets at about 200 Hz. The described microfluidic system is easily adapted for cancer cell screening. The microfluidic procedure takes 4 hours to screen 1 million cells.
Figure 1. Principle of cancer cell sorting
Materials and Methods
Materials
We bought 98.0 percent diphenyl ether from the German company Merck, 98.0 percent 1, 4-phenylenediamine, 99.9 percent ethanol, and 96.0 percent n-hexane. Phosphate buffer saline (PBS) was made by dissolving enough NaCl (99.5%, Merck), KCl (99.5%, Merck), Na2HPO4 (99.0%, Merck), and KH2PO4 (99.5%, Merck) in DI water (18 M Ohm) and adjusting the solution to the desired pH (7.4). From Sinopharm Chemical Reagent Co., Ltd., China, we bought sodium hydroxide (NaOH, A.R.), ammonia (NH3H2O, 28–30 wt %), and hydrogen peroxide (H2O2, 30 wt %), and tetraethylorthosilicate (TEOS, A.R.). Aladdin Industrial Corporation in China sold (3- aminopropyl) triethoxysilane (APTES) that was 99 percent pure.
Synthesis of GQDs
P-phenylenediamine was dissolved in diphenyl ether at 80°C. This mixture was heated to 200°C for eight hours. To precipitate CQDs, the suspension is cooled to room temperature and then poured into hexane. Three times by precipitation and centrifugation at 4000 rpm, GQDs were obtained from the solution.
Synthesis of MSN
After loading CTAB, deionized water, NH3-H2O, and ethanol into a glass reactor, they were stirred for 30 minutes at 40 ° C. After that, TEOS and APTES were added. The resultant was stirred for an additional 12 hr. The precipitate was separated from the solution by centrifugation and then washed three times with a solution of water and ethanol. Extraction using combinations of MeOH and HCl was finally used to eliminate CTAB and other organic components. The prepared precipitate was mixed with methanol and hydrochloric acid and stirred for 6 hours at 60°C, and the final product was separated by centrifugation.
Synthesis of GQDs@MSN
MSN-NH2 that had already been made was put into the GQDs aqueous solution and mixed with an ultrasonic mixer for 30 minutes. The mixture was then stirred at room temperature for 12 hours and left to sit at room temperature overnight. The solution was then put through an ultracentrifuge, and the precipitates were washed five times with deionized water and ethanol. They were then dried in an oven at 80 °C for 12 hours.
Cell Sorting
In cell culture flasks containing DMEM with 15% FBS and 1% penicillin/streptomycin, MCF-7, and NIH3T3 cells were seeded at a density of 1×10⁶ cells per flask. Cells are cultured at 37 ͦC and in 5% carbon dioxide. To remove the cell layer, add 3 mL of a solution that contains 0.25% trypsin and 0.53 mM of EDTA. Trypsin has to be neutralized by adding 10 mL of full growth media to the flask once the MCF-7 cell layer has been removed. On the other hand, Use CAD software, such as Autodesk AutoCAD, to design the pattern of a droplet microfluidic system printed on a photolithography mask. Features in the provided designs should be printed at a minimum of 24,000 d.p.i. to achieve sufficient resolution. After that, we dilute the cell suspension and insert it into the inlet channel of the microfluidic device.
Results
Characterizations of nanoparticles.
Figure 2 a and b illustrate the pore size and N2 adsorption and desorption isotherms of the MSN and GQD@MSN. As can be seen in Figure 2a, the isotherm of MSN is classified into the category of type IV isotherms, which are typical of materials with a mesoporous structure. At a P/Po ratio of 0.20, the surface area of a single point is 402.81 m2/g. The corresponding pore size distribution was calculated from the adsorption branch of the nitrogen isotherm by the BJH method, and it shows a narrow pore size distribution peak at 4.40 nm. Additionally, the single point adsorption total pore volume of pores less than 69.28 nm diameter at P/Po = 0.97 is 0.47 cm3/g. A representative type IV curve can be shown in Figure 2b for the N2 adsorption-desorption isotherms of GQDs@MSN. This curve has a specific surface area of 640.82 m2/g, an average pore width of 4.02 nm, and the total pore volume of pores is 0.70 cm3/g. Additionally, the specific surface area and total pore volume of pores were increased, while the average pore diameter was scarcely decreased. This could be attributed to the fact that the pore depth increased upon the attachment of GQDs on the surface of MSN by electrostatic interaction. These results indicate that the as-synthesized GQDs@MSN with mesoporous structures and large surface area may feature significant GQDs loading capacity as contrast agents.
Figure 2c presents the FT-IR spectrum of p-PD, GQD, MSN, and GQD@MSN. The GQD exhibited unique characteristic peaks at around 2848–2918 cm-1, 1336–1384 cm-1, and 1225–1234 cm-1 that were not present in the starting materials (p-PD). They are associated with the aliphatic stretching vibrations (ʋC-H, ʋ C-N=, ʋC-O), which imply intermolecular cyclization, decomposition, and condensation reactions during the production of the GQDs. To confirm the validity of the MSN, the stretching vibrations of Si-O-Si (1086 cm-1; 798 cm-1) and the bands at 948 cm-1 of Si-OH were used. OH, stretching vibrations of hydrogen-bonded surface silanol groups and water adsorption were also attributed to a prominent peak at 3439 cm-1. MSN was effectively synthesized using the aforesaid approach, as shown by the peaks at 1627 cm-1 and 1500 cm-1, which were attributed to the H-O-H bending vibrations of physically adsorbed water and the N-H vibration stretching, respectively. Compared to MSN, a new weak peak appeared at 1470 cm-1 and 618 cm-1, which were attributed to the N-H stretching vibration and C-N stretching vibration, respectively. GQDs were shown to be an excellent surface decoration for the MSN, as demonstrated by these findings. Figure 1d shows the PL intensity of GQD@MSN. The corresponding peak at the excitation wavelength of 450 nm has been prepared, which has a sharp and robust emission peak at 600 nm, making it an ideal candidate for photoluminescence properties.
Figure 2. (a) N2 adsorption/desorption isotherms of MSN (b) N2 adsorption/desorption isotherms of GQDs@MSN. The plots of pore size distribution from the adsorption curve are shown. (c) FT-IR spectra of p-PD, GQD, MSN, GQDs@MSN (d) The PL intensity of GQDs@MSN ( ex= 450 nm)
The FESEM image of the prepared GQDs@MSN is illustrated in Figure 3. As seen in Figure 3, GQDs@MSN are nanoparticles with a uniform spherical shape and an average particle size of 250 nm. In addition, DLS data indicate that the size of these nanoparticles is slightly larger than this amount, which explains this variation in hydrodynamic nanoparticle diameter.
Figure 3. FESEM of a GQD@MSNs. The morphology of these particles is spherical, and the average particle size is around 250 nm.
The design of the droplet microfluidic chip was taken based on one of the articles related to the research team of Mazutis et al. (17), and it was ready to be used after preparing the mask and lithography steps (Figure 4a). After MCF-7 cells and NIH3T3 fibroblasts were cultured, they were separated from the culture medium and entered into one of the microfluidic input channels, and GQD@MSN were entered from the other channel. After the cells and GQD@MSN were trapped inside the droplets and after 15 minutes of incubation, they were re-entered the microfluidic channel, and after the amplified fluorescent signal inside the cells was observed through the electrical signal applied by the Au electrode, cancer cells were isolated (Figure 4b and c).
Figure 4. (a) Design of microfluidic devices. (b) Bright-field image of droplet MCF-7 cells after microfluidic sorting (c) Red fluorescenc single MCF-7 cells
Discussion
The data relating to pore size and N2 gas adsorption and desorption isotherms shown that utilizing MSN as a porous carrier could be a highly perfect choice for delivering graphene quantum dots. The specific surface area and pore volume of GQD-MSNs were found to be 50% and 40% higher than those of pure MSNs, which is rather remarkable. Because of these improved qualities, GQD-MSNs are demonstrated a large sorting capacity that makes them ideal for diagnosis. On the other hand, the utilization of silica nanoparticles reduces the toxicity of these quantum data and results in substantially less damage being caused to the cells. In addition, our results suggested that the synthesized GQDs@MSN, with their mesoporous architectures and large surface areas could be able to greatly boost the loading capacity of fluorescent materials. The formation of graphene quantum dots was further demonstrated by FTIR research, which also demonstrated that the loading of quantum graphene into MSN is a physical process.
Conclusion
In conclusion, we have demonstrated that GQD@MSN can separate cancer cells from other types of cells. This separation can also be achieved by altering the surface of GQD@MSN with specific antibodies. Here, using a pre-designed chip, we efficiently separated cancer cells from normal cells using the threshold signal. It should be no surprise that the biocompatibility of the nanoparticles utilized in the experiment might be helpful in future analyses of the separated cells. To extract data about DNA, for instance, it should go without saying that these GQD@MSN should not harm the protein structure or any of the other components of the cell. As a result, the development of such chemicals is still in the early stages of research and development.
Acknowledgments
Dr. Omid Sabzevari thanks funding support of Iran National Science Foundation (INSF, Grant No. 96004438).
Funding source(s)
This research was funded by Iran National Science Foundation (INSF, Grant No. 96004438) and the grant program of Sharif University of Technology (Grant No. QA970816) and the Iran National Science Foundation (INSF, Grant No. 95-S-48740 and 96016364).
Conflict of interest
There are no conflicts of interests to declare.
Type of Article: Original article |
Subject:
Molecular Sciences
Received: 2022/08/3 | Accepted: 2022/08/9 | Published: 2022/08/23
Received: 2022/08/3 | Accepted: 2022/08/9 | Published: 2022/08/23
References
1. Guo MT, Rotem A, Heyman JA, Weitz DA. Droplet microfluidics for high-throughput biological assays. Lab Chip [Internet]. 2012;12(12):2146-55. [DOI] [PMID] [Google Scholar]
2. Kintses B, van Vliet LD, Devenish SRA, Hollfelder F. Microfluidic droplets: new integrated workflows for biological experiments. Curr Opin Chem Biol [Internet]. 2010;14(5):548-55. [DOI] [PMID] [Google Scholar]
3. Dove A. Drug screening-beyond the bottleneck. Nat Biotechnol [Internet]. 1999;17(9):859-63. [view at publisher] [DOI] [PMID] [Google Scholar]
4. Popat A, Hartono SB, Stahr F, Liu J, Qiao SZ, Qing Max Lu G. Mesoporous silica nanoparticles for bioadsorption, enzyme immobilisation, and delivery carriers. Nanoscale. 2011 Jul;3(7):2801-18. [DOI] [PMID] [Google Scholar]
5. He Q, Shi J. Mesoporous silica nanoparticle based nano drug delivery systems: synthesis, controlled drug release and delivery, pharmacokinetics and biocompatibility. J Mater Chem [Internet]. 2011;21(16):5845-55. [DOI] [Google Scholar]
6. Popat A, Ross BP, Liu J, Jambhrunkar S, Kleitz F, Qiao SZ. Enzyme-Responsive Controlled Release of Covalently Bound Prodrug from Functional Mesoporous Silica Nanospheres. Angew Chemie Int Ed [Internet]. 2012 Dec 7;51(50):12486-9. [DOI] [PMID] [Google Scholar]
7. Liu J, Xiong R, Brans T, Lippens S, Parthoens E, Zanacchi FC, et al. Repeated photoporation with graphene quantum dots enables homogeneous labeling of live cells with extrinsic markers for fluorescence microscopy. Light Sci Appl [Internet]. 2018;7(1):47. [view at publisher] [DOI] [PMID] [PMCID] [Google Scholar]
8. Tarn D, Ashley CE, Xue M, Carnes EC, Zink JI, Brinker CJ. Mesoporous silica nanoparticle nanocarriers: biofunctionality and biocompatibility. Acc Chem Res. 2013 Mar;46(3):792-801. [view at publisher] [DOI] [PMID] [PMCID] [Google Scholar]
9. Lee JE, Lee N, Kim H, Kim J, Choi SH, Kim JH, et al. Uniform mesoporous dye-doped silica nanoparticles decorated with multiple magnetite nanocrystals for simultaneous enhanced magnetic resonance imaging, fluorescence imaging, and drug delivery. J Am Chem Soc. 2010 Jan;132(2):552-7. [view at publisher] [DOI] [PMID] [Google Scholar]
10. Radu DR, Lai C-Y, Jeftinija K, Rowe EW, Jeftinija S, Lin VS-Y. A polyamidoamine dendrimer-capped mesoporous silica nanosphere-based gene transfection reagent. J Am Chem Soc. 2004 Oct;126(41):13216-7. [DOI] [PMID] [Google Scholar]
11. Slowing II, Trewyn BG, Giri S, Lin VS-Y. Mesoporous Silica Nanoparticles for Drug Delivery and Biosensing Applications. Adv Funct Mater [Internet]. 2007 May 21;17(8):1225-36. [DOI] [Google Scholar]
12. Wang Y, Li Z, Hu D, Lin C-T, Li J, Lin Y. Aptamer/graphene oxide nanocomplex for in situ molecular probing in living cells. J Am Chem Soc. 2010 Jul;132(27):9274-6. [DOI] [PMID] [Google Scholar]
13. Huang S, Song L, Xiao Z, Hu Y, Peng M, Li J, et al. Graphene quantum dot-decorated mesoporous silica nanoparticles for high aspirin loading capacity and its pH-triggered release. Anal Methods [Internet]. 2016;8(12):2561-7. [DOI] [Google Scholar]
14. Shen J, Zhu Y, Yang X, Li C. Graphene quantum dots: emergent nanolights for bioimaging, sensors, catalysis and photovoltaic devices. Chem Commun [Internet]. 2012;48(31):3686-99. [DOI] [PMID] [Google Scholar]
15. Suzuki K, Yamato K, Sekiya R, Haino T. Photoluminescence responses of graphene quantum dots toward organic bases and an acid. Photochem Photobiol Sci [Internet]. 2017;16(5):623-6. [DOI] [PMID] [Google Scholar]
16. Liang Z, Khawar MB, Liang J, Sun H. Bio-Conjugated Quantum Dots for Cancer Research: Detection and Imaging. Front Oncol. 2021;11:749970. [DOI] [PMID] [PMCID] [Google Scholar]
17. Mazutis L, Gilbert J, Ung WL, Weitz DA, Griffiths AD, Heyman JA. Single-cell analysis and sorting using droplet-based microfluidics. Nat Protoc. 2013 May 4;8(5):870-91. [view at publisher] [DOI] [PMID] [PMCID] [Google Scholar]
Send email to the article author
| Rights and permissions | |
 |
This work is licensed under a Creative Commons Attribution-NonCommercial 4.0 International License. |
