
Volume 9, Issue 2 (5-2021)
Jorjani Biomed J 2021, 9(2): 55-67 |
Back to browse issues page

Download citation:
BibTeX | RIS | EndNote | Medlars | ProCite | Reference Manager | RefWorks
Send citation to:


BibTeX | RIS | EndNote | Medlars | ProCite | Reference Manager | RefWorks
Send citation to:
Fathi I, nourshahi M. Investigating the Response of Lipid Profile, Insulin Resistance and Mitochondrial Biogenesis of Obese Rats to Various Training. Jorjani Biomed J 2021; 9 (2) :55-67
URL: http://goums.ac.ir/jorjanijournal/article-1-830-en.html
URL: http://goums.ac.ir/jorjanijournal/article-1-830-en.html


1- Department of Sport Sciences, Faculty of Literature and Humanities, Vali-e-Asr University of Rafsanjan, Iran , imanfathi@vru.ac.ir
2- Department of Sport Biological Science, Faculty of Sport Sciences and Health, Shahid Behesht University, Tehran,Iran
2- Department of Sport Biological Science, Faculty of Sport Sciences and Health, Shahid Behesht University, Tehran,Iran
Full-Text [PDF 863 kb]
(1122 Downloads)
| Abstract (HTML) (3311 Views)
.png)
.png)
.png)
.png)
.png)
.png)
.png)
.png)
.png)
Discussion
One of the most common metabolic disorders in obese people is insulin resistance, which is known to increase the risk of developing type 2 diabetes and other chronic diseases (39, 40). Therefore, any interventions that help improve insulin sensitivity can be considered as an important treatment strategy; In this regard, it has been found that proper exercise can improve and increase insulin sensitivity and therefore can be considered as a useful way to control body weight (40, 41). One of the points to consider is that despite the lack of weight change, the mechanisms that improve exercise-induced insulin sensitivity in obese people remain largely unknown.
The present study showed that the forced exercise protocols, i.e. continuous and high intensity interval training (HIIT & CT), reduced lipid profiles despite rats continued consumption of high-fat diet (HFD). Moreover, exercise training normalized insulin resistance in obese rats. Visceral fat was significantly increased in rats fed a high-fat diet (HFD) (HIIT, CT, and OB groups) compared with control (chow) animals. However, exercise training (HIIT & CT) significantly reduced the level of visceral fat. Also, although weight and visceral fat decreased in HFD-exercise rats compared to HFD-no exercise animals (OB group), it still remained higher than in chow-no exercise rats. Thus, although exercise training has been shown to modulate the metabolic phenotype of obese rats, it has not been able to return their increased fat to its normal level.
However, the results showed that in the exercise groups, decrease in weight and visceral fat were associated with a complete reversal of insulin resistance due to obesity. In addition, insulin resistance in the exercise group reached normal levels similar to those in the non-obese control group, although it was significantly lower than in the obese control group. As well as in HFD rats the levels of insulin and fasting plasma glucose were higher compared with chow rats nevertheless decreased via exercise in both groups (HIIT & CT). It has been reported that forced exercise improved visceral fat and weight in HFD-exercise rats (HIIT & CT) and despite continued consumption of HFD, normalization of insulin sensitivity persisted also in HFD-exercise rats reduction in LDL, TC and TG was seen compared with HFD-no exercise rats but HDL levels in plasma raised only in the HIIT and CT groups. Exercises can improve the lipid profile by phosphorylation of hormone-sensitive lipase in adipose tissue and muscle via increasing Catecholamines and cAMP and also increase insulin sensitivity, glucose uptake and the number of GLUT-4 in the cell membrane surface (42, 43). It has been reported that exercise with intensity of 27–44% of VO2max enhanced oxygen consumption, HbA1c and FBS in elderly diabetic patients (44). For improving lipid profile, the intensity of exercise seems to be a main factor. Researchers reported that HIIT and MICT enhanced HbA1c, FBS and weight as well as the effect of HIIT was more desirable than MICT (45). In line with noted data four weeks exercise improved LDL/HDL ratio, TC/HDL ratio, and HDL (46). PGC1α levels in parallel with lipid and glycemic indices changed so that PGC1α levels increased in training groups but decreased in OB group. Various studies have highlighted the importance of cell mitochondria as the core of many of these changes. For example, a close association has been observed between insulin sensitivity and mitochondrial function in obesity (47), type 2 diabetes (48), and old age (49, 50).
In response to exercise, PGC-1α expression is regulated by increased oxygen free species (ROS), AMP to ATP ratio, and changes in calcium concentration (51). Activation of Ca2+/calmodulin dependent protein kinase IV and Calcineurin A has been shown to contribute to PGC-1α expression through binding of CREB and MEF2 to general binding sites (52). In addition, activation of p38MAPK during exercise can induce phosphorylation of MEF2 and ATF2, both of which bind to the PGC1-α promoter and increase its expression. It has also been observed that p38 can phosphorylate PGC1-α and lead to the stability of the PGC1-α protein (53).
Also, with exercise, the ratio of AMP to ATP increases, which changes the energy state of the cell and thus activates AMPK. Activation of AMPK leads to direct phosphorylation of PGC-1-α.
Therefore, due to the high intensity of HIIT training, it is likely to have a greater effect on PGC1α upstream signals (ie, oxygen free species, AMP to ATP ratio, and changes in calcium concentration) and lead to more changes in PGC1α; This was consistent with the results of the present study because the concentration of PGC1α in the HIIT group was higher than the CT group.
Conclusion
In conclusion, our study provides relatively identical responses of lipid profile (TG, TC, LDL, and HDL), insulin resistance, visceral fat to the high-intensity interval, and continuous training. Also, we show that the amount of muscle PGC1α in HIIT and CT groups was significantly higher than OB and Cont groups. Moreover, serum levels of glucose, insulin, and insulin resistance in HIIT and CT groups were significantly lower than the OB group; However, these glycemic indices weren’t significantly different from the control group.
Authors’ Contribution
All authors had an equal role in study design, work, statistical analysis and manuscript writing.
Conflicts of interest
There are no conflicts of interest.
Funding/Support:
This research did not receive any specific grants from any funding agencies in the public, commercial, or not-for-profit sectors.
Interpretation and diagnosis of the underlying molecular mechanisms of obesity and metabolic syndrome has been one of the most widely performed activities in modern medicine. Exercise training has been suggested as a healthy and promising intervention for obese and overweight people.
Full-Text: (723 Views)
Highlights
Interpretation and diagnosis of the underlying molecular mechanisms of obesity and metabolic syndrome has been one of the most widely performed activities in modern medicine. Exercise training has been suggested as a healthy and promising intervention for obese and overweight people.
Introduction
Over the past 50 years, obesity has increased worldwide and reached pandemic proportions (1). Obesity is associated with various diseases and is known as a multifactorial disease. Although the rate of obesity is higher in women and the elderly, the prevalence of obesity has increased in both sexes and all ages, regardless of ethnicity, geographical location, or socioeconomic status (2). Obese people are more at risk for diseases such as obstructive sleep apnea, multiple cancers, hypertension, heart attack, osteoarthritis, fatty liver disease, dementia, stroke, and type 2 diabetes, so obesity is an important health challenge (1). Research has shown that increasing the accumulation of fat in the body can increase insulin resistance, which is a disorder of insulin signaling by increasing the accumulation of oxygen free radicals, inflammatory cytokines, and mitochondrial dysfunction of various tissues in the body such as muscle and adipose tissues (3-5). In fact, it has been shown that increased adipose tissue accumulation is primarily associated with insulin resistance (6, 7). Studies have also shown that in addition to white and brown adipose tissue, other adipose tissue known as beige adipose tissue can also play an important role in insulin resistance (8, 9). It is important to note that peripheral insulin resistance usually occurs following obesity (10). In these pathological conditions, body tissues cannot respond to insulin and lead to hyperinsulinemia, which is one of the main symptoms of diabetes mellitus. Following hyperinsulinemia and impaired insulin signaling, the physiological function of various organs is impaired. In this regard, mitochondria are a vital intracellular organ that is both a source of cellular energy and a source of oxygen free radicals and plays an important role in insulin signaling (11). Therefore, dysfunction of cellular organs such as mitochondria can be related to the development of insulin resistance in various tissues of the body (12, 13).
Interpretation and diagnosis of the underlying molecular mechanisms of obesity and metabolic syndrome has been one of the most widely performed activities in modern medicine. Various studies have cited the importance of cell mitochondria as the core of many of these changes. For example, there is a close relationship between insulin sensitivity and mitochondrial function in obesity (14), type 2 diabetes (15), aging (16, 17) and also in the origin of people with type 2 diabetes (18) and it reinforces the hypothesis that the decrease in insulin sensitivity is due to a muscular mitochondrial disorder (18) or vice versa (11). Various protein factors have been observed in relation to mitochondrial function and biogenesis, the most important of which are PGC1α (19). PGCLα[1] is a nuclear receptor coactivator that plays several roles in metabolic regulation (20, 21). PGCLα stimulates mitochondrial biogenesis (19) and alteration of muscle fibers, increasing oxidative capacity in skeletal muscle (22). Given the apparent link between mitochondrial disorders and metabolic syndrome, researchers are widely seeking to examine the effects of various interventions on mitochondrial status in obese individuals and reduce its complications and ultimately increase life expectancy.
Today, exercise training has been suggested as a healthy and promising intervention for obese and overweight people (23). In this regard, research shows that gain aerobic fitness and muscle strength through exercise training can improve metabolic disorders and prevent chronic diseases. These benefits are partially mediated by extensive molecular and metabolic remodeling in skeletal muscle resulting from exercise (24). For example, Spina et al., in a study examined the effect of cycle ergometer training on mitochondrial enzymes in human skeletal muscle. Twelve non-athletes underwent a training period of 7 or 10 days on a cycle ergometer for 2 hours a day with 60-70% of peak VO2. The results show that the activities of beta-hydroxyacyl-CoA dehydrogenase, citrate synthase, carnitine acetyltransferase, and mitochondrial thiolase were increased by approximately 30% in training group. Eventually they reported that in humans, as in rats, the adaptive increase in mitochondrial enzymes in skeletal muscle occurs in response to exercise training (25). Exercise adaptations can include changes in the structure and function of contractile proteins (26), mitochondrial function (25), metabolic regulation (27), intracellular messaging (28), and transcriptional responses (29). Therefore, it is necessary to build efficient and shorter training methods that have beneficial effects like traditional training methods. Hence, the present study seeks to answer the question of whether there is a difference between the effect of eight weeks of continuous training and intense interval training on lipid profile, insulin resistance, serum glucose, visceral fat, and PGCLα levels of muscle tissue.
Materials and Methods
Animals. Male Wistar rats were randomly assigned to six groups (n=5/group), treated with either regular chow diet or high-fat diet and with or without exercise training for a total of 16 wk. All rats were housed in individual cages, and exercise training consisted of forced continuous and high intensity interval running. The animals were kept in a room with a controlled (temperature 22±1/4 ◦C, humidity 55±4%, 12:12 h light–dark cycle) and completely quiet environment, and had free access to water. All experiments were approved by the Animal Care and Use Committee of Shahid Beheshti University, Tehran, Iran.
.png)
Interpretation and diagnosis of the underlying molecular mechanisms of obesity and metabolic syndrome has been one of the most widely performed activities in modern medicine. Exercise training has been suggested as a healthy and promising intervention for obese and overweight people.
Introduction
Over the past 50 years, obesity has increased worldwide and reached pandemic proportions (1). Obesity is associated with various diseases and is known as a multifactorial disease. Although the rate of obesity is higher in women and the elderly, the prevalence of obesity has increased in both sexes and all ages, regardless of ethnicity, geographical location, or socioeconomic status (2). Obese people are more at risk for diseases such as obstructive sleep apnea, multiple cancers, hypertension, heart attack, osteoarthritis, fatty liver disease, dementia, stroke, and type 2 diabetes, so obesity is an important health challenge (1). Research has shown that increasing the accumulation of fat in the body can increase insulin resistance, which is a disorder of insulin signaling by increasing the accumulation of oxygen free radicals, inflammatory cytokines, and mitochondrial dysfunction of various tissues in the body such as muscle and adipose tissues (3-5). In fact, it has been shown that increased adipose tissue accumulation is primarily associated with insulin resistance (6, 7). Studies have also shown that in addition to white and brown adipose tissue, other adipose tissue known as beige adipose tissue can also play an important role in insulin resistance (8, 9). It is important to note that peripheral insulin resistance usually occurs following obesity (10). In these pathological conditions, body tissues cannot respond to insulin and lead to hyperinsulinemia, which is one of the main symptoms of diabetes mellitus. Following hyperinsulinemia and impaired insulin signaling, the physiological function of various organs is impaired. In this regard, mitochondria are a vital intracellular organ that is both a source of cellular energy and a source of oxygen free radicals and plays an important role in insulin signaling (11). Therefore, dysfunction of cellular organs such as mitochondria can be related to the development of insulin resistance in various tissues of the body (12, 13).
Interpretation and diagnosis of the underlying molecular mechanisms of obesity and metabolic syndrome has been one of the most widely performed activities in modern medicine. Various studies have cited the importance of cell mitochondria as the core of many of these changes. For example, there is a close relationship between insulin sensitivity and mitochondrial function in obesity (14), type 2 diabetes (15), aging (16, 17) and also in the origin of people with type 2 diabetes (18) and it reinforces the hypothesis that the decrease in insulin sensitivity is due to a muscular mitochondrial disorder (18) or vice versa (11). Various protein factors have been observed in relation to mitochondrial function and biogenesis, the most important of which are PGC1α (19). PGCLα[1] is a nuclear receptor coactivator that plays several roles in metabolic regulation (20, 21). PGCLα stimulates mitochondrial biogenesis (19) and alteration of muscle fibers, increasing oxidative capacity in skeletal muscle (22). Given the apparent link between mitochondrial disorders and metabolic syndrome, researchers are widely seeking to examine the effects of various interventions on mitochondrial status in obese individuals and reduce its complications and ultimately increase life expectancy.
Today, exercise training has been suggested as a healthy and promising intervention for obese and overweight people (23). In this regard, research shows that gain aerobic fitness and muscle strength through exercise training can improve metabolic disorders and prevent chronic diseases. These benefits are partially mediated by extensive molecular and metabolic remodeling in skeletal muscle resulting from exercise (24). For example, Spina et al., in a study examined the effect of cycle ergometer training on mitochondrial enzymes in human skeletal muscle. Twelve non-athletes underwent a training period of 7 or 10 days on a cycle ergometer for 2 hours a day with 60-70% of peak VO2. The results show that the activities of beta-hydroxyacyl-CoA dehydrogenase, citrate synthase, carnitine acetyltransferase, and mitochondrial thiolase were increased by approximately 30% in training group. Eventually they reported that in humans, as in rats, the adaptive increase in mitochondrial enzymes in skeletal muscle occurs in response to exercise training (25). Exercise adaptations can include changes in the structure and function of contractile proteins (26), mitochondrial function (25), metabolic regulation (27), intracellular messaging (28), and transcriptional responses (29). Therefore, it is necessary to build efficient and shorter training methods that have beneficial effects like traditional training methods. Hence, the present study seeks to answer the question of whether there is a difference between the effect of eight weeks of continuous training and intense interval training on lipid profile, insulin resistance, serum glucose, visceral fat, and PGCLα levels of muscle tissue.
Materials and Methods
Animals. Male Wistar rats were randomly assigned to six groups (n=5/group), treated with either regular chow diet or high-fat diet and with or without exercise training for a total of 16 wk. All rats were housed in individual cages, and exercise training consisted of forced continuous and high intensity interval running. The animals were kept in a room with a controlled (temperature 22±1/4 ◦C, humidity 55±4%, 12:12 h light–dark cycle) and completely quiet environment, and had free access to water. All experiments were approved by the Animal Care and Use Committee of Shahid Beheshti University, Tehran, Iran.
- Study Design
Of these animals, 24 were fed a high-fat diet over an 8-week period. Then, to evaluate the effect of time and obesity intervention, 6 rats were randomly selected and sacrificed. Then, after one week of familiarity with the treadmill and the laboratory environment, the remaining animals (i.e., 18 obese 16-week-old rats) were randomly divided into three groups: obese control (OB), continuous aerobic training (CT), and high-intensity interval training (HIIT) (based on equal in terms of average fatigue rate). All three groups (OB, CT, HIIT) continued to eat high-fat foods for eight weeks, and except for the OB group, the CT and HIIT groups performed their specific training.
After 48 hours of rest from the last familiarization session, the rats were subjected to a fatigue test to measure the maximum speed and the maximum oxygen consumption was predicted using the maximum speed at the time of exhaustion (30). Then, for eight weeks, the CT and HIIT groups performed their specific training three times a week. 48 hours after the last training session, the rats were anesthetized with pentobarbital sodium for surgery and molecular cell tests.
After 48 hours of rest from the last familiarization session, the rats were subjected to a fatigue test to measure the maximum speed and the maximum oxygen consumption was predicted using the maximum speed at the time of exhaustion (30). Then, for eight weeks, the CT and HIIT groups performed their specific training three times a week. 48 hours after the last training session, the rats were anesthetized with pentobarbital sodium for surgery and molecular cell tests.
- Obesity
In most studies, obesity in small animals is determined based on weight gain (or increased body fat content) in the experimental group compared to the control group (31-33). If the weight gains in the experimental group reaches 10 to 25% more than the control group, it is considered moderate obesity and if it reaches more than 40%, it is considered severe obesity (33). Another index used to determine obesity in rats is the Lee obesity index, which is calculated by dividing the third root of weight (grams) by the nose-rectal height (cm) and multiplying by 1000 (34). In the present study, obesity was determined by comparing the weights of the experimental groups (HIIT, CT and OB) with the non-obese control group (Cont).
- Vo2max
The standard Bedford et al. (1979) incremental test was used to determine the maximum oxygen consumption. The test consists of 10 three-minute steps. The speed in the first stage is 0.3 km / h and in the next stages 0.3 km / h must be added to the speed of the treadmill (35).
- HIIT and Continuous Aerobic Training Protocols
The high-intensity interval training protocol consisted of three parts: warm-up (5 minutes), exercise consisting of 2-minute (2*2) interval repetitions (with a 2-minute active recovery period between each interval), and cool down (5 minutes) (36). High-intensity interval course includes 2 minutes with 80% maximum intensity in the first week; 90% of the maximum was in the second week, 100% of the maximum in the third week and 110% of the maximum speed from the beginning of the fourth week to the end of the workout.
In the endurance training group, rats performed continuous training after 5 minutes of running (warm-up), with an intensity of 65% of maximum speed in the first week, 70% of maximum speed in the second week, and 75% of maximum speed from the third week onwards. The running time of the rats was equal to the training time of the HIIT group. Finally, the rats were cooled for 5 minutes at 50 to 60% of maximum speed.
In the endurance training group, rats performed continuous training after 5 minutes of running (warm-up), with an intensity of 65% of maximum speed in the first week, 70% of maximum speed in the second week, and 75% of maximum speed from the third week onwards. The running time of the rats was equal to the training time of the HIIT group. Finally, the rats were cooled for 5 minutes at 50 to 60% of maximum speed.
- Sample Preparation
At the end of the study period and 48 h after the last training session, rats were anaesthetized with ketamine (50-65 mg/kg) and xylazine (10-15 mg/kg), and after blood and tissue (soleus muscle) sampling, samples were transferred to the laboratory to measure PGC1α protein, glycemic indices and lipid profile. Fasting insulin was measured by sandwich and competitive enzyme immunoassay (Crystal Chem, Downers Grove, IL) and fasting glucose was measured by biochemical kit and enzymatic method (glucose oxidase method- Pars Azmun Co). The HOMA-IR formula [HOMA-IR ¼ [glucose (nmol/L) × insulin (mU/mL)/22.5] (37) was used to measure insulin resistance. Lipid profiles were measured enzymatically using commercial biochemistry kits (Pars Azmun Co, Iran). The level of PGC1α protein were quantified by western blotting (Anti-PGC1α antibody ab54481- Abcam Co; Anti-rabbit IgG, HRP-linked Antibody #7074).
- Western Blot for PGC1α
Tissue collection, homogenization and protein electrophoresis were performed as previously described (38). Protein (50 μg) or 40 μl of medium supernatant from each sample was subjected to 4–20% pre-cast polyacrylamide gel electrophoresis (Bio-Rad). PGC1α was detected with 1:1000 dilution of antibody, followed by 1:2000 dilution of anti-rabbit labeled antibody (Rabbit polyclonal to PGC1 alpha - BSA and Azide free-ab54481). ECL substrate kit (Amersham) was used for the chemiluminscent detection of the signals with autoradiography film (Amersham).
- Statistical Analysis
All data were expressed as mean ± SD. Shapiro–Wilk test was used for investigate the normal distribution of data and one-way ANOVA along with Bonferroni’s post-hoc test were used for analyses the research findings (p≤ .05).
Result
Weight, visceral fat, serum levels of lipid profiles, and glycemic indices are present in Figures 1–9. The results showed that visceral fat, serum levels of lipid profiles (LDL, HDL, TC, and TG), and glycemic indices (glucose, insulin, insulin resistance) in the HIIT and CT groups (exercise groups) at the end of the study period (24 weeks) were significantly different from the OB group (P=0.000).
The results also showed that body weight at the end of the study period was significantly different between exercise groups and obese control group (OB) and body weight was lower in exercise groups (p =0.000) (Figure 1). Weight gain was 27% in the OB group and about 7% in the exercise group.
At the end of the study period, the exercise groups had significantly lower visceral fat than the OB group, although it was still significantly higher than the control group (P≤ 0.05) (Figure 2). The increase in visceral fat was 27% in the OB group, while a decrease of 30% and 43% was observed in the HIIT and CT groups, respectively.
Serum levels of glucose, insulin, and insulin resistance in HIIT and CT groups (At 24 weeks) were significantly lower than the OB group (p≤0.05); However, these glycemic indices weren’t significantly different from the control group (P≥0.05) (Figures 3-5).
Figure 1. Weights in research groups.
The results also showed that serum levels of HDL of exercise groups and even control group were significantly higher than OB group (p≤0.05); However, serum levels of LDL, TC, and TG of control and exercise groups were significantly lower than OB group (p≤0.05) (Figures 6-9).
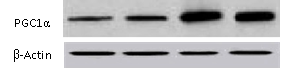
The results of one-way analysis of variance showed that the level of PGC1α protein of soleus muscle (SOL) in the HIIT and CT groups at the end of the study period were significantly different from the OB group (P=0.000). The results of the Bonferroni post hoc test showed that the amount of PGC1α protein in exercise groups was significantly higher than in control and obese groups (p≤0.05) (Figures 10).
The results of one-way analysis of variance showed that the level of PGC1α protein of soleus muscle (SOL) in the HIIT and CT groups at the end of the study period were significantly different from the OB group (P=0.000). The results of the Bonferroni post hoc test showed that the amount of PGC1α protein in exercise groups was significantly higher than in control and obese groups (p≤0.05) (Figures 10).
Figure 10. levels of PGC1α in research groups. HIIT: high-intensity interval training group. CT: continuous training group. OB: obesity group. Cont.: control group. Data are means ± SE. *P≤ 0.05 vs. OB.
Discussion
One of the most common metabolic disorders in obese people is insulin resistance, which is known to increase the risk of developing type 2 diabetes and other chronic diseases (39, 40). Therefore, any interventions that help improve insulin sensitivity can be considered as an important treatment strategy; In this regard, it has been found that proper exercise can improve and increase insulin sensitivity and therefore can be considered as a useful way to control body weight (40, 41). One of the points to consider is that despite the lack of weight change, the mechanisms that improve exercise-induced insulin sensitivity in obese people remain largely unknown.
The present study showed that the forced exercise protocols, i.e. continuous and high intensity interval training (HIIT & CT), reduced lipid profiles despite rats continued consumption of high-fat diet (HFD). Moreover, exercise training normalized insulin resistance in obese rats. Visceral fat was significantly increased in rats fed a high-fat diet (HFD) (HIIT, CT, and OB groups) compared with control (chow) animals. However, exercise training (HIIT & CT) significantly reduced the level of visceral fat. Also, although weight and visceral fat decreased in HFD-exercise rats compared to HFD-no exercise animals (OB group), it still remained higher than in chow-no exercise rats. Thus, although exercise training has been shown to modulate the metabolic phenotype of obese rats, it has not been able to return their increased fat to its normal level.
However, the results showed that in the exercise groups, decrease in weight and visceral fat were associated with a complete reversal of insulin resistance due to obesity. In addition, insulin resistance in the exercise group reached normal levels similar to those in the non-obese control group, although it was significantly lower than in the obese control group. As well as in HFD rats the levels of insulin and fasting plasma glucose were higher compared with chow rats nevertheless decreased via exercise in both groups (HIIT & CT). It has been reported that forced exercise improved visceral fat and weight in HFD-exercise rats (HIIT & CT) and despite continued consumption of HFD, normalization of insulin sensitivity persisted also in HFD-exercise rats reduction in LDL, TC and TG was seen compared with HFD-no exercise rats but HDL levels in plasma raised only in the HIIT and CT groups. Exercises can improve the lipid profile by phosphorylation of hormone-sensitive lipase in adipose tissue and muscle via increasing Catecholamines and cAMP and also increase insulin sensitivity, glucose uptake and the number of GLUT-4 in the cell membrane surface (42, 43). It has been reported that exercise with intensity of 27–44% of VO2max enhanced oxygen consumption, HbA1c and FBS in elderly diabetic patients (44). For improving lipid profile, the intensity of exercise seems to be a main factor. Researchers reported that HIIT and MICT enhanced HbA1c, FBS and weight as well as the effect of HIIT was more desirable than MICT (45). In line with noted data four weeks exercise improved LDL/HDL ratio, TC/HDL ratio, and HDL (46). PGC1α levels in parallel with lipid and glycemic indices changed so that PGC1α levels increased in training groups but decreased in OB group. Various studies have highlighted the importance of cell mitochondria as the core of many of these changes. For example, a close association has been observed between insulin sensitivity and mitochondrial function in obesity (47), type 2 diabetes (48), and old age (49, 50).
In response to exercise, PGC-1α expression is regulated by increased oxygen free species (ROS), AMP to ATP ratio, and changes in calcium concentration (51). Activation of Ca2+/calmodulin dependent protein kinase IV and Calcineurin A has been shown to contribute to PGC-1α expression through binding of CREB and MEF2 to general binding sites (52). In addition, activation of p38MAPK during exercise can induce phosphorylation of MEF2 and ATF2, both of which bind to the PGC1-α promoter and increase its expression. It has also been observed that p38 can phosphorylate PGC1-α and lead to the stability of the PGC1-α protein (53).
Also, with exercise, the ratio of AMP to ATP increases, which changes the energy state of the cell and thus activates AMPK. Activation of AMPK leads to direct phosphorylation of PGC-1-α.
Therefore, due to the high intensity of HIIT training, it is likely to have a greater effect on PGC1α upstream signals (ie, oxygen free species, AMP to ATP ratio, and changes in calcium concentration) and lead to more changes in PGC1α; This was consistent with the results of the present study because the concentration of PGC1α in the HIIT group was higher than the CT group.
Conclusion
In conclusion, our study provides relatively identical responses of lipid profile (TG, TC, LDL, and HDL), insulin resistance, visceral fat to the high-intensity interval, and continuous training. Also, we show that the amount of muscle PGC1α in HIIT and CT groups was significantly higher than OB and Cont groups. Moreover, serum levels of glucose, insulin, and insulin resistance in HIIT and CT groups were significantly lower than the OB group; However, these glycemic indices weren’t significantly different from the control group.
Authors’ Contribution
All authors had an equal role in study design, work, statistical analysis and manuscript writing.
Conflicts of interest
There are no conflicts of interest.
Funding/Support:
This research did not receive any specific grants from any funding agencies in the public, commercial, or not-for-profit sectors.
Type of Article: Original article |
Subject:
General medicine
Received: 2021/04/26 | Accepted: 2021/06/20 | Published: 2021/06/20
Received: 2021/04/26 | Accepted: 2021/06/20 | Published: 2021/06/20
References
1. Blüher M. Obesity: global epidemiology and pathogenesis. Nature Reviews Endocrinology. 2019;15(5):288. [view at publisher] [DOI] [Google Scholar]
2. Chooi YC, Ding C, Magkos F. The epidemiology of obesity. Metabolism. 2019;92:6-10. [view at publisher] [DOI] [Google Scholar]
3. Schinner S, Scherbaum W, Bornstein S, Barthel A. Molecular mechanisms of insulin resistance. Diabetic Medicine. 2005;22(6):674-82. [view at publisher] [DOI] [Google Scholar]
4. Martyn JJ, Kaneki M, Yasuhara S. Obesity-induced insulin resistance and hyperglycemia: etiological factors and molecular mechanisms. Anesthesiology. 2008;109(1):137. [view at publisher] [DOI] [Google Scholar]
5. Gutiérrez-Rodelo C, Roura-Guiberna A, Olivares-Reyes JA. Molecular mechanisms of insulin resistance: An update. Gac Med Mex. 2017;153(2):214-28. [Google Scholar]
6. Chondronikola M, Volpi E, Børsheim E, Porter C, Annamalai P, Enerbäck S, et al. Brown adipose tissue improves whole-body glucose homeostasis and insulin sensitivity in humans. Diabetes. 2014;63(12):4089-99. [view at publisher] [DOI] [Google Scholar]
7. Zhou L, Park S-Y, Xu L, Xia X, Ye J, Su L, et al. Insulin resistance and white adipose tissue inflammation are uncoupled in energetically challenged Fsp27-deficient mice. Nature communications. 2015;6(1):1-14. [view at publisher] [DOI] [Google Scholar]
8. Lizcano F, Vargas D. Biology of beige adipocyte and possible therapy for type 2 diabetes and obesity. International journal of endocrinology. 2016;2016. [view at publisher] [DOI] [Google Scholar]
9. Min SY, Kady J, Nam M, Rojas-Rodriguez R, Berkenwald A, Kim JH, et al. Human'brite/beige adipocytes develop from capillary networks, and their implantation improves metabolic homeostasis in mice. Nature medicine. 2016;22(3):312. [view at publisher] [DOI] [Google Scholar]
10. Boden G. 45Obesity, insulin resistance, and free fatty acids. Current opinion in endocrinology, diabetes, and obesity. 2011;18(2):139. [view at publisher] [DOI] [Google Scholar]
11. Cheng Z, Tseng Y, White MF. Insulin signaling meets mitochondria in metabolism. Trends in Endocrinology & Metabolism. 2010;21(10):589-98. [view at publisher] [DOI] [Google Scholar]
12. Kim J-a, Wei Y, Sowers JR. Role of mitochondrial dysfunction in insulin resistance. Circulation research. 2008;102(4):401-14. [view at publisher] [DOI] [Google Scholar]
13. Montgomery MK, Turner N. Mitochondrial dysfunction and insulin resistance: an update. Endocrine Connections. 2015;4(1): R1-R15. [view at publisher] [DOI] [Google Scholar]
14. Simoneau J-A, Kelley DE. Altered glycolytic and oxidative capacities of skeletal muscle contribute to insulin resistance in NIDDM. Journal of Applied Physiology. 1997;83(1):166-71. [view at publisher] [DOI] [Google Scholar]
15. Kelley DE, He J, Menshikova EV, Ritov VB. Dysfunction of mitochondria in human skeletal muscle in type 2 diabetes. Diabetes. 2002;51(10):2944-50. [view at publisher] [DOI] [Google Scholar]
16. Petersen KF, Befroy D, Dufour S, Dziura J, Ariyan C, Rothman DL, et al. Mitochondrial dysfunction in the elderly: possible role in insulin resistance. Science. 2003;300(5622):1140-2. [view at publisher] [DOI] [Google Scholar]
17. Short KR, Bigelow ML, Kahl J, Singh R, Coenen-Schimke J, Raghavakaimal S, et al. Decline in skeletal muscle mitochondrial function with aging in humans. Proceedings of the National Academy of Sciences. 2005;102(15):5618-23. [view at publisher] [DOI] [Google Scholar]
18. Petersen KF, Dufour S, Befroy D, Garcia R, Shulman GI. Impaired mitochondrial activity in the insulin-resistant offspring of patients with type 2 diabetes. New England Journal of Medicine. 2004;350(7):664-71. [view at publisher] [DOI] [Google Scholar]
19. Wu Z, Puigserver P, Andersson U, Zhang C, Adelmant G, Mootha V, et al. Mechanisms controlling mitochondrial biogenesis and respiration through the thermogenic coactivator PGC-1. Cell. 1999;98(1):115-24. [view at publisher] [DOI] [Google Scholar]
20. Finck BN, Kelly DP. PGC-1 coactivators: inducible regulators of energy metabolism in health and disease. The Journal of clinical investigation. 2006;116(3):615-22. [DOI] [Google Scholar]
21. Handschin C, Spiegelman BM. Peroxisome proliferator-activated receptor γ coactivator 1 coactivator, energy homeostasis, and metabolism. Endocrine reviews. 2006;27(7):728-35. [view at publisher] [DOI] [Google Scholar]
22. Lin J, Wu H, Tarr PT, Zhang C-Y, Wu Z, Boss O, et al. Transcriptional co-activator PGC-1α drives the formation of slow-twitch muscle fibers. Nature. 2002;418(6899):797-801. [view at publisher] [DOI] [Google Scholar]
23. Siegel D. Exercise training in obese children and adolescents. Journal of Physical Education, Recreation & Dance. 2006;77(4):12-. [view at publisher] [DOI] [Google Scholar]
24. Egan B, Zierath JR. Exercise metabolism and the molecular regulation of skeletal muscle adaptation. Cell metabolism. 2013;17(2):162-84. [view at publisher] [DOI] [Google Scholar]
25. Spina RJ, Chi M, Hopkins MG, Nemeth P, Lowry O, Holloszy J. Mitochondrial enzymes increase in muscle in response to 7-10 days of cycle exercise. Journal of applied physiology. 1996;80(6):2250-4. [view at publisher] [DOI] [Google Scholar]
26. Widrick JJ, Stelzer JE, Shoepe TC, Garner DP. Functional properties of human muscle fibers after short-term resistance exercise training. American Journal of Physiology-Regulatory, Integrative and Comparative Physiology. 2002;283(2): R408-R16. [view at publisher] [DOI] [Google Scholar]
27. Green H, Helyar R, Ball-Burnett M, Kowalchuk N, Symon S, Farrance B. Metabolic adaptations to training precede changes in muscle mitochondrial capacity. Journal of Applied Physiology. 1992;72(2):484-91. [view at publisher] [DOI] [Google Scholar]
28. Benziane B, Burton TJ, Scanlan B, Galuska D, Canny BJ, Chibalin AV, et al. Divergent cell signaling after short-term intensified endurance training in human skeletal muscle. American Journal of Physiology-Endocrinology and Metabolism. 2008;295(6): E1427-E38. [view at publisher] [DOI] [Google Scholar]
29. Pilegaard H, Saltin B, Neufer PD. Exercise induces transient transcriptional activation of the PGC‐1α gene in human skeletal muscle. The Journal of physiology. 2003;546(3):851-8. [view at publisher] [DOI] [Google Scholar]
30. Helgerud J, Hoydal K, Wang E, Karlsen T, Berg P, Bjerkaas M, et al. Aerobic High-Intensity Intervals Improve VO~ 2~ m~ a~ x More Than Moderate Training. Medicine and science in sports and exercise. 2007;39(4):665. [DOI] [Google Scholar]
31. Ghibaudi L, Cook J, Farley C, Heek M, Hwa JJ. Fat intake affects adiposity, comorbidity factors, and energy metabolism of Sprague‐Dawley rats. Obesity research. 2002;10(9):956-63. [view at publisher] [DOI] [Google Scholar]
32. Woods SC, Seeley RJ, Rushing PA, D'Alessio D, Tso P. A controlled high-fat diet induces an obese syndrome in rats. The Journal of nutrition. 2003;133(4):1081-7. [view at publisher] [DOI] [Google Scholar]
33. Levin BE, Dunn-Meynell AA. Defense of body weight depends on dietary composition and palatability in rats with diet-induced obesity. American Journal of Physiology-Regulatory, Integrative and Comparative Physiology. 2002;282(1): R46-R54. [view at publisher] [DOI] [Google Scholar]
34. Lee MO. Determination of the surface area of the white rat with its application to the expression of metabolic results. American Journal of Physiology--Legacy Content. 1929;89(1):24-33. [view at publisher] [DOI] [Google Scholar]
35. Leandro CG, Levada AC, Hirabara SM, MANHAS-DE-CASTRO R, De-Castro CB, Curi R, et al. A PROGRAM OF MODERATE PHYSICAL TRAINING FOR WISTAR RATS BASED ON MAXIMAL OXYGEN CONSUMPTION. The Journal of Strength & Conditioning Research. 2007;21(3):751-6. [DOI] [Google Scholar]
36. Haram PM, Kemi OJ, Lee SJ, Bendheim MØ, Al-Share QY, Waldum HL, et al. Aerobic interval training vs. continuous moderate exercise in the metabolic syndrome of rats artificially selected for low aerobic capacity. Cardiovascular research. 2009;81(4):723-32. [view at publisher] [DOI] [Google Scholar]
37. Hosseini SA, Hamzavi K, Safarzadeh H, Salehi OJAoP, Biochemistry. Interactive effect of swimming training and fenugreek (Trigonella foenum graecum L.) extract on glycemic indices and lipid profile in diabetic rats. 2020:1-5. [view at publisher] [DOI] [Google Scholar]
38. Wagner KF, Hellberg A-K, Balenger S, Depping R, Dodd-O J, Johns RA, et al. Hypoxia-induced mitogenic factor has antiapoptotic action and is upregulated in the developing lung: coexpression with hypoxia-inducible factor-2α. 2004;31(3):276-82. [view at publisher] [DOI] [Google Scholar]
39. Shoelson SJI, Invest irJC. Lee j, Goldfine AB. 2006;116:1793-801. [DOI]
40. Henriksen EJJJoap. Invited review: Effects of acute exercise and exercise training on insulin resistance. 2002;93(2):788-96. [DOI] [Google Scholar]
41. Ivy JJP, Rev ton-i-ddmESS. Zderic TW, Fogt DL. 1999;27:1-35. [DOI]
42. Zheng X, Qi Y, Bi L, Shi W, Zhang Y, Zhao D, et al. Effects of exercise on blood glucose and glycemic variability in type 2 diabetic patients with dawn phenomenon. 2020;2020. [view at publisher] [DOI] [Google Scholar]
43. Hosseini A, Khoshsovt F, Ahmadi M, Azarbayjani MA, Salehi O, Farkhaie FJN, et al. Effects of aloe vera and swimming training on lipid profile of streptozotocin-induced diabetic rats. 2020;7(1):9-16. [view at publisher] [DOI] [Google Scholar]
44. Jiang Y, Tan S, Wang Z, Guo Z, Li Q, Wang JJJoes, et al. Aerobic exercise training at maximal fat oxidation intensity improves body composition, glycemic control, and physical capacity in older people with type 2 diabetes. 2020;18(1):7-13. [view at publisher] [DOI] [Google Scholar]
45. Liu J-x, Zhu L, Li P-j, Li N, Xu Y-bJAc, research e. Effectiveness of high-intensity interval training on glycemic control and cardiorespiratory fitness in patients with type 2 diabetes: a systematic review and meta-analysis. 2019;31(5):575-93. [view at publisher] [DOI] [Google Scholar]
46. Kazeminasab F, Marandi M, Ghaedi K, Esfarjani F, Moshtaghian JJCJ. Effects of a 4-week aerobic exercise on lipid profile and expression of LXRα in rat liver. 2017;19(1):45. [view at publisher] [Google Scholar]
47. Simoneau J-A, Kelley DEJJoAP. Altered glycolytic and oxidative capacities of skeletal muscle contribute to insulin resistance in NIDDM. 1997;83(1):166-71. [view at publisher] [DOI] [Google Scholar]
48. Kelley DE, He J, Menshikova EV, Ritov VBJD. Dysfunction of mitochondria in human skeletal muscle in type 2 diabetes. 2002;51(10):2944-50. [view at publisher] [DOI] [Google Scholar]
49. Petersen KF, Befroy D, Dufour S, Dziura J, Ariyan C, Rothman DL, et al. Mitochondrial dysfunction in the elderly: possible role in insulin resistance. 2003;300(5622):1140-2. [view at publisher] [DOI] [Google Scholar]
50. Short KR, Bigelow ML, Kahl J, Singh R, Coenen-Schimke J, Raghavakaimal S, et al. Decline in skeletal muscle mitochondrial function with aging in humans. 2005;102(15):5618-23. [view at publisher] [DOI] [Google Scholar]
51. Erlich AT, Tryon LD, Crilly MJ, Memme JM, Moosavi ZSM, Oliveira AN, et al. Function of specialized regulatory proteins and signaling pathways in exercise-induced muscle mitochondrial biogenesis. 2016;5(3):187-97. [view at publisher] [DOI] [Google Scholar]
52. Fernandez-Marcos PJ, Auwerx JJTAjocn. Regulation of PGC-1α, a nodal regulator of mitochondrial biogenesis. 2011;93(4):884S-90S. [view at publisher] [DOI] [Google Scholar]
53. Zhang Y, Uguccioni G, Ljubicic V, Irrcher I, Iqbal S, Singh K, et al. Multiple signaling pathways regulate contractile activity‐mediated PGC‐1α gene expression and activity in skeletal muscle cells. 2014;2(5):e12008. [view at publisher] [DOI] [Google Scholar]
Send email to the article author
| Rights and permissions | |
 |
This work is licensed under a Creative Commons Attribution-NonCommercial 4.0 International License. |
